Is it necessary to read a Crypto chart? Yes, to identify the single market move and to build strong predictions about the fluctuating value of crypto, we must read the crypt chart. A Crypto chart is a graphical representation of historical values and data regarding crypto, it gives us the knowledge about ups and downs in the crypto market. In this article, we are going to discuss how to read the crypto chart.
How to Read Crypto Chart
Chart reading is very important for investors for technical analysis so they can make investment plans based on historical data given in the chart. Here is a step-by-step guide to reading the chart:
Step 1: Visit the Website Trading Website
The very first step to the trading view is the website where investors, traders, and business enthusiasts share their reviews and ideas about the market trend. Click here to visit this website:

Step 2: Explore the Market
Go to the market, here you can see all the markets and assets like stock, crypto, forex, indices, and bonds. Select a market, for instance, I want to explore cryptocurrency. Just select it and open it:

Step 3: Explore the Cryptocurrency Market
Click on the search box to view all cryptocurrencies:

By default, it will display all the assets, but if you want to explore crypto, you just have to click on Crypto. Similarly, all the cryptocurrencies will be displayed in the drop-down list:
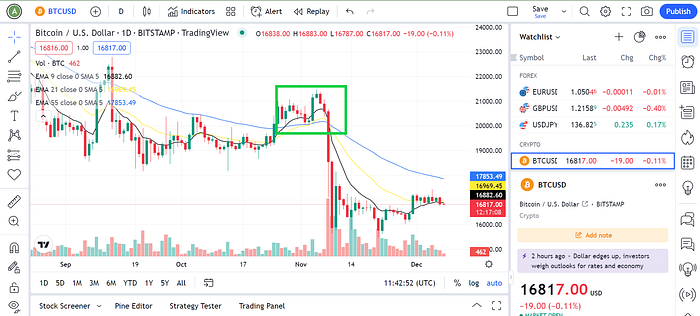
Select one of them, like BTCUSD, and finally launch a chart:

The chart will appear, and now the next move would be how to identify the given chart like when we should sell and buy the coins with the help of the chart:

Step 4: Reading the Crypto Chart
Technical Analysis, also called the Moving Average (MA), is used by traders and investors to analyze the next market move.
For technical analysis click on the indicators:

Type EMA in the search bar for Moving Average Exponential, it is a technical chart and tracks the investment price:

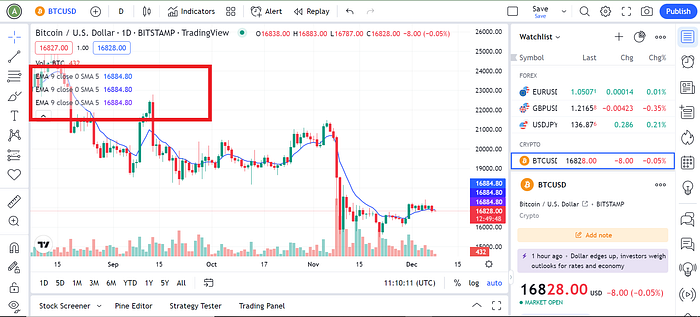
Click on Moving Average Exponential 3 times

After clicking 3 times, 3 EMAs will be generated. Click one by one on each EMA and change the styling to make them visible:
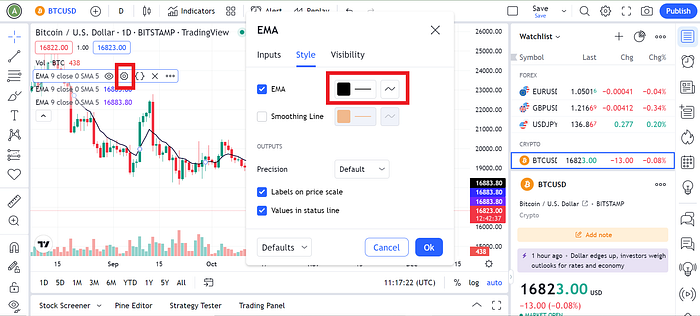
Click on the first EMA, go to Settings, and then click on the Style tab and change the color to make it visible, and hit the Ok button:
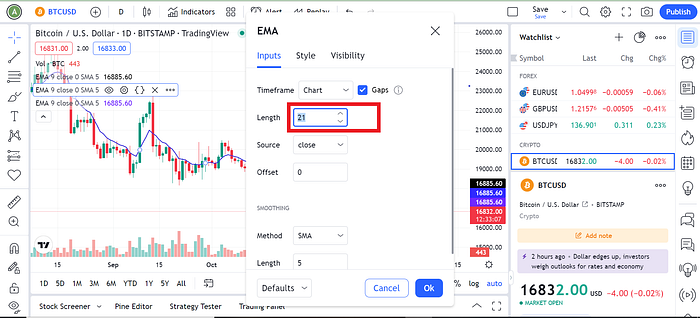
Click on the second EMA, go to Settings, click on Style, and change the color to make it visible. Click on Input and set the length to 21, and hit the Ok button:
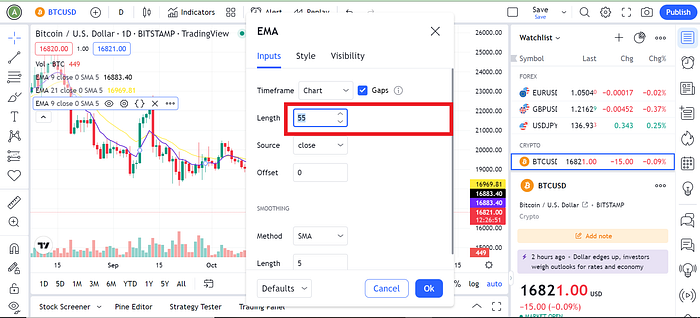
Click on the third EMA, go to Settings, click on Style, and change the color to make it visible.
Click on Input and set the Length to 55, and hit the Ok button:
We have to consider EMA 9 to predict the fluctuating value of crypto if EMA 9 line lies above the EMA 21 and EMA 55, it means the crypto value is increasing and high, else if it lies under the EMA 21 or EMA 55 that means it values is decreasing:
Conclusion
According to the above-given graph generated by the trading view, we can predict the fluctuating value of crypto with the help of this graph and can take our next step when the market goes down our next move should be to sell out the crypto but when its value increases then we should have to buy crypto. Through this strategy, anyone can become a successful investor, but the thing is to learn the tricks and tips.